Last updated: 2026-07-02
LS100 READING GUIDE
A Navigational Guide to Statistical Methods
Souvik Mandal, Ph.D., Linkedin ID: souvik-mandal-phd
Project Leader & Instructor, Computational Behavioral Sciences, LS100, FAS, Harvard University
Behavioral data are often messy, count-heavy, zero-inflated, or tightly clustered within individuals, and rarely arrive in a clean, normally distributed package. Choosing the correct statistical tool requires diagnosing both the nature of your research question and the structural features of your data. This guide is a diagnostic map: instead of detailing the underlying mathematics, it tells you — given (a) your research question and (b) your data’s features — (c) which statistical test family is appropriate. Within each objective, tests are ordered from the most general/basic to the most case-specific/advanced tests. Use it together with the one-page decision-tree poster that accompanies this guide.
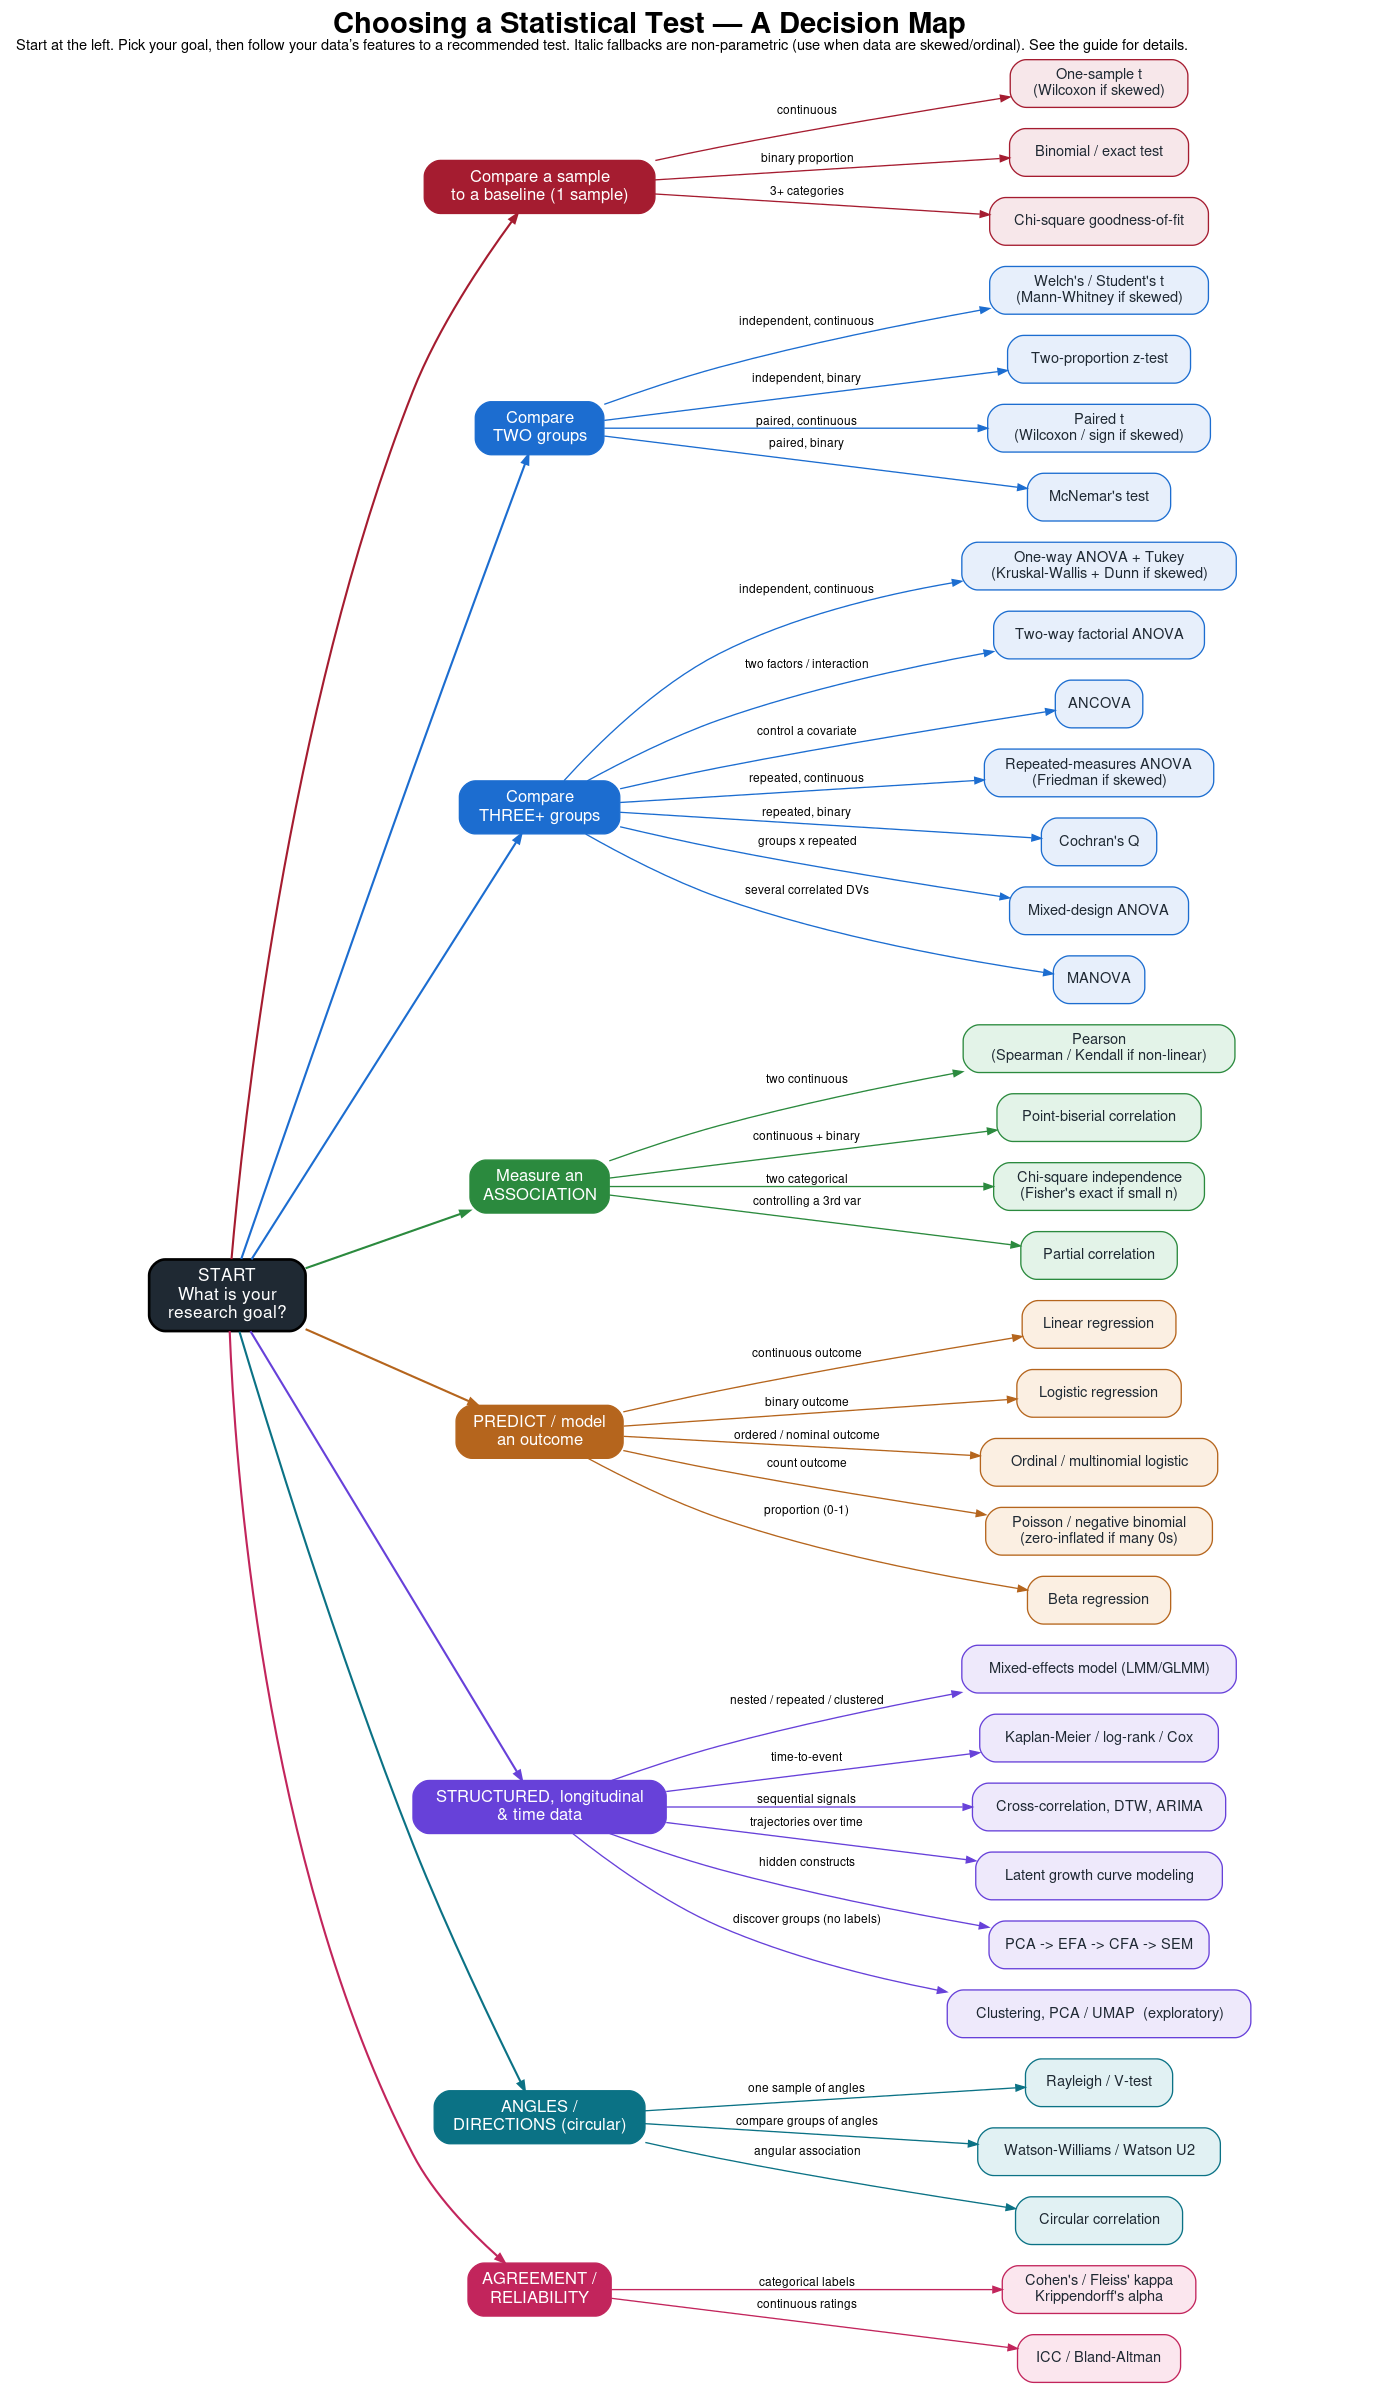
Step 0: Characterize Your Question and Your Data¶
Before opening any test, answer the following five questions. Your answers point directly to a section below (and to a branch of the decision-tree poster).
What is the goal? compare a sample to a baseline (§1), compare groups (§2–§3), measure an association (§4), build a predictive model (§5), handle nested/longitudinal/time data (§6), analyze angles/directions (§7), or quantify rater agreement (§8).
What type is the/ outcome (dependent) variable? continuous, ordinal, nominal/binary, a count, a proportion, a time-to-event, or a circular angle.
What is the predictor / grouping structure? none (one sample), one grouping with two vs. three-or-more groups, one or more continuous predictors, or several factors at once.
Are observations independent or related? independent groups or paired/repeated/nested (the same individuals measured more than once).
Is the outcome roughly normal, or skewed/ordinal? this decides parametric vs. non-parametric — confirm it with the diagnostics in §9.
Please refer to Table 01 for a quick glance of the appropriate statistical test for a given research question and features of the data.
Table 01: Quick-Reference for Appropriate Statistical Test
A fast lookup for the most common situations. Find your row, then read the detailed entry in the section indicated.
| Your question / goal | Outcome type | Design | Go-to test(s) (§section) |
|---|---|---|---|
| Compare one mean to a fixed value | Continuous | One sample | One-sample t test, Wilcoxon if skewed (§1) |
| Compare one proportion to a value | Binary | One sample | Binomial / exact test (§1) |
| Category counts vs. expected | Nominal | One sample | Chi-square goodness-of-fit (§1) |
| Compare two group means | Continuous | 2 independent | Welch’s / Student’s t-test, Mann-Whitney if skewed (§2) |
| Compare two paired means | Continuous | Paired | Paired t-test, Wilcoxon signed-rank if skewed (§2) |
| Compare two proportions | Binary | 2 independent | Two-proportion z test, chi-square (§2) |
| Compare paired proportions | Binary | Paired | McNemar’s test (§2, §4) |
| Compare 3+ group means | Continuous | 3+ independent | One-way ANOVA + post-hoc test, Kruskal-Wallis if skewed (§3) |
| Compare 3+ repeated conditions | Continuous | Repeated | Repeated-measures ANOVA test, Friedman if skewed (§3) |
| Two factors + their interaction | Continuous | Factorial | Two-way ANOVA (§3) |
| Group means controlling a covariate | Continuous | + covariate | ANCOVA (§3) |
| Several correlated outcomes at once | 2+ continuous | Groups | MANOVA (§3) |
| Association of two continuous vars | Continuous | — | Pearson test, Spearman/Kendall if non-linear (§4) |
| Association of two categorical vars | Categorical | — | Chi-square test, Fisher’s exact if small n (§4) |
| Predict a continuous outcome | Continuous | Predictors | Linear regression (§5) |
| Predict a binary / categorical outcome | Binary/nominal | Predictors | Logistic regression family (§5) |
| Predict a count | Count | Predictors | Poisson test, negative binomial if over-dispersed (§5) |
| Nested / repeated / clustered data | Any | Clustered | Mixed-effects model (LMM/GLMM) (§6) |
| Time-until-a-behavior | Duration + censoring | — | Kaplan-Meier / log-rank / Cox (§6) |
| Similarity of two movement sequences | Sequences | — | Cross-correlation, Dynamic Time Warping (§6) |
| Preferred direction / angle | Circular | — | Rayleigh test, Watson-Williams to compare (§7) |
| Agreement between coders / raters | Categorical or continuous | Raters | Cohen’s/Fleiss’ kappa test, ICC (§8) |
Single-Sample Diagnostics: Comparing a Group to a Baseline¶
Use these when you have a single sample and want to know if it differs from a known baseline, a theoretical constant, or a chance probability.
One-Sample t-test
Alternative names: Single-sample t-test
Data features: One continuous variable; data should look roughly bell-shaped (normally distributed).
When to use: To check if your sample’s mean differs from a known or hypothesized population mean.
Behavioral example: Testing if the average response time of users on a new interface differs from the established industry baseline of 2.5 seconds.
One-Sample Wilcoxon Signed-Rank Test
Alternative names: Wilcoxon signed-rank test for a single sample
Data features: One continuous or highly ordinal variable; heavily skewed or non-normal.
When to use: The non-parametric alternative to the one-sample t-test, for data that violate normality or are ranked/ordinal.
Behavioral example: Testing if the median satisfaction score (1–7 Likert) after an intervention differs from a neutral score of 4.
Binomial / Exact Test
Alternative names: Exact binomial test
Data features: One binary categorical variable (success/failure); valid at any sample size.
When to use: To compare an observed proportion of a binary outcome against a hypothesized probability — the most basic single-sample categorical test.
Behavioral example: Testing whether an animal chooses the left arm of a T-maze more often than the 50% expected by chance across 20 trials.
Chi-Square Goodness-of-Fit Test
Alternative names: One-way chi-square test, multinomial goodness-of-fit test
Data features: One categorical variable (nominal or ordinal) with three or more categories.
When to use: To determine if an observed frequency distribution across categories matches an expected/theoretical distribution.
Behavioral example: Investigating whether participants select three digital avatars with equal probability or prefer a specific one.
Comparing Two Groups¶
These assess differences between exactly two groups, conditions, or time points.
Independent (unrelated) groups
Independent-samples t-test
Alternative names: Student’s t-test, two-sample t-test, unpaired t-test
Data features: One categorical IV (2 mutually exclusive groups); one continuous DV. Assumes normality and equal variances.
When to use: The classic test to compare the average outcomes of two separate, independent groups.
Behavioral example: Comparing average test scores of an experimental learning group against a traditional control group.
Welch’s t-test
Alternative names: Welch’s unequal-variances t-test
Data features: One categorical IV (2 groups); one continuous DV. Does NOT assume equal variances or equal group sizes.
When to use: The safer default for comparing two independent means — generally recommended over Student’s t whenever variances or group sizes may differ.
Behavioral example: Comparing mean stride length between a small expert group and a larger novice group whose variability differs.
Mann-Whitney U Test
Alternative names: Wilcoxon rank-sum test, Mann-Whitney-Wilcoxon (MWW) test
Data features: One categorical IV (2 groups); one ordinal or non-normal continuous DV.
When to use: The non-parametric equivalent of the independent-samples t-test, for skewed or ordinal outcomes.
Behavioral example: Comparing daily social-media posts between two groups, where counts are highly skewed (many users post 0).
Two-Sample Z-test for Proportions
Alternative names: Two-proportion z-test
Data features: One categorical IV (2 groups); one binary DV (e.g., Yes/No). Requires a large sample (np ≥ 10 and n(1−p) ≥ 10).
When to use: Comparing the proportion of a specific outcome between two separate groups.
Behavioral example: An A/B test comparing click-through rate between a blue and a green landing-page button.
Paired / related measurements
Paired-Samples t-test¶
Alternative names: Dependent t-test, repeated-measures t-test, matched-pairs t-test
Data features: Two continuous measurements from the same individuals (or matched pairs). Assumes the paired differences are normal.
When to use: To evaluate the difference between two related means, as in pre-test/post-test designs.
Behavioral example: Measuring participant anxiety before and immediately after a stress-reduction session.
Sign Test¶
Alternative names: Paired sign test
Data features: Two related measurements; uses only the direction (not the magnitude) of each pair’s difference. Minimal assumptions.
When to use: The simplest paired test, for when you can only trust the sign of each change (ordinal or grossly non-normal differences).
Behavioral example: Whether posture symmetry improved (better/worse) after a training session, judged per participant.
Wilcoxon Signed-Rank Test (Paired)¶
Alternative names: Wilcoxon matched-pairs signed-rank test
Data features: Two related/paired measurements; ordinal or heavily skewed, non-normal differences.
When to use: The non-parametric equivalent of the paired t-test, for pre/post or matched designs violating normality.
Behavioral example: Comparing self-reported urge to smoke (skewed 1–10 scale) before and after viewing a health-warning graphic.
3. Comparing Three or More Groups: Factorial & Multi-Variable Designs¶
When your design expands beyond two groups or includes multiple intersecting factors.
Alternative names: One-factor analysis of variance, single-factor ANOVA
Data features: One categorical IV (≥ 3 groups); one continuous DV. Assumes normal residuals and equal variances.
When to use: To determine whether the means of three or more independent groups differ.
Behavioral example: Comparing attention-span scores across silent rooms, rooms with classical music, and rooms with open-office noise.
Welch’s ANOVA¶
Alternative names: Heteroscedastic one-way ANOVA
Data features: One categorical IV (≥ 3 groups); one continuous DV with unequal variances.
When to use: A one-way comparison of 3+ means when variances differ across groups (the ANOVA analogue of Welch’s t).
Behavioral example: Comparing mean call duration across three animal colonies whose variability differs markedly.
Kruskal-Wallis Test¶
Alternative names: Kruskal-Wallis one-way ANOVA by ranks, non-parametric one-way ANOVA
Data features: One categorical IV (≥ 3 groups); one ordinal or non-normal continuous DV.
When to use: The non-parametric alternative to one-way ANOVA, for skewed or ordinal outcomes.
Behavioral example: Comparing the ranking of product frustrations across three user-experience cohorts.
Post-hoc Pairwise Comparisons¶
Alternative names: Tukey HSD, Games-Howell, Dunn’s test, Bonferroni/Holm correction
Data features: Follows a significant omnibus test (ANOVA or Kruskal-Wallis).
When to use: After a significant omnibus result, to find WHICH specific group pairs differ while controlling the family-wise error rate — Tukey HSD (equal variances), Games-Howell (unequal variances), Dunn’s test (after Kruskal-Wallis).
Behavioral example: An ANOVA shows attention differs across three sound environments; Tukey HSD identifies which pairs actually differ.
Alternative names: Multi-way ANOVA, factorial analysis of variance
Data features: Two or more categorical IVs (factors); one continuous DV.
When to use: To examine the simultaneous effect of two factors and, critically, their interaction (whether one factor’s effect depends on the other).
Behavioral example: Testing how reward type (cash vs. praise) and task difficulty (easy vs. hard) interact to affect performance time.
ANCOVA¶
Alternative names: Analysis of covariance
Data features: One or more categorical IVs; one continuous DV; one or more continuous covariates to control for.
When to use: To compare group means while statistically controlling for a continuous confounding variable.
Behavioral example: Comparing post-test comprehension across three teaching methods while controlling for baseline pre-test scores.
MANOVA¶
Alternative names: Multivariate analysis of variance
Data features: One or more categorical IVs; two or more related, correlated continuous DVs.
When to use: To test whether groups differ on a combined multivariate profile, rather than running separate ANOVAs per outcome.
Behavioral example: Testing whether three personality types differ simultaneously across eye-fixation duration, click rate, and scrolling speed.
Alternative names: Within-subjects ANOVA, dependent ANOVA
Data features: The same subjects measured across ≥ 3 conditions or time points; one continuous DV. Assumes sphericity.
When to use: When tracking change across multiple time points, or exposing the same participants to 3+ treatments.
Behavioral example: Tracking cognitive fatigue measured at hour 1, hour 3, and hour 5 of a continuous testing block.
Friedman Test¶
Alternative names: Friedman two-way ANOVA by ranks, non-parametric repeated-measures ANOVA
Data features: One within-subjects factor (≥ 3 related conditions/time points); ordinal or non-normal continuous DV.
When to use: The non-parametric alternative to repeated-measures ANOVA; pair with a Dunn’s or Nemenyi post-hoc.
Behavioral example: Comparing a skewed comfort rating from the same users across three prosthetic settings.
Cochran’s Q Test¶
Alternative names: Cochran Q
Data features: One within-subjects factor (≥ 3 related conditions); one binary DV.
When to use: The extension of McNemar’s test to three or more repeated binary measurements.
Behavioral example: Whether the same animals succeed/fail at a task across three successive training days.
Mixed-Design ANOVA¶
Alternative names: Split-plot ANOVA, between-within ANOVA, mixed factorial ANOVA
Data features: At least one between-subjects factor (different groups) and at least one within-subjects factor (repeated measures); one continuous DV.
When to use: The classic randomized-controlled-trial framework: does a treatment group change over time differently than a control group?
Behavioral example: Measuring depression scores at pre-test, post-test, and 6-month follow-up (within) for a treatment and a control group (between).
4. Associations, Relationships & Contingencies¶
These assess how variables change together, whether continuous scales or categorical labels.
Pearson Correlation¶
Alternative names: Pearson product-moment correlation coefficient (r)
Data features: Two continuous variables. Assumes a linear relationship, normality, and homoscedasticity.
When to use: To measure the strength and direction of a linear relationship between two continuous metrics.
Behavioral example: Relating total hours spent on an educational platform to final exam grade.
Spearman’s Rank Correlation¶
Alternative names: Spearman’s ρ (rho), rank-order correlation
Data features: Two continuous or ordinal variables. No normality/linearity assumption; tracks monotonic relationships.
When to use: The non-parametric alternative to Pearson, for curved relationships or ranked data.
Behavioral example: Correlating a user’s self-reported stress rank with their rank of daily screen time.
Kendall’s Tau¶
Alternative names: Kendall’s τ coefficient, Kendall’s rank correlation
Data features: Two ordinal or continuous variables.
When to use: A non-parametric alternative optimal for small samples or many tied ranks; more robust than Spearman in sparse data.
Behavioral example: Correlating preference rankings of 8 interface mockups between two small focus groups.
Point-Biserial Correlation¶
Alternative names: A special case of the Pearson correlation
Data features: One continuous variable and one binary categorical variable.
When to use: To quantify the association between a continuous measure and a two-level grouping (equivalent to an independent t-test, expressed as a correlation).
Behavioral example: Relating movement smoothness to group membership (trained vs. untrained).
Partial Correlation¶
Data features: Two continuous variables plus one or more continuous control variables.
When to use: To measure the association between two variables while holding a third constant, removing its confounding influence.
Behavioral example: Relating practice hours to performance while controlling for baseline fitness.
Chi-Square Test of Independence¶
Alternative names: Pearson’s chi-square test, chi-square bivariate test
Data features: Two categorical variables. Large samples where every expected cell count is ≥ 5.
When to use: To determine whether two categorical variables are significantly associated.
Behavioral example: Testing whether political affiliation is associated with preferred media medium (text, video, audio).
Fisher’s Exact Test¶
Alternative names: Fisher-Irwin test
Data features: Two categorical variables, typically a 2 × 2 table. Used when samples are small or events rare (any expected cell < 5).
When to use: An exact calculation used when the large-sample approximation of the chi-square test breaks down.
Behavioral example: Whether a rare side effect is associated with a new drug vs. placebo in a small study.
McNemar’s Test¶
Alternative names: McNemar’s chi-square test
Data features: Two paired/dependent nominal variables, structured as a 2 × 2 table of before/after binary states.
When to use: To analyze changes in paired categorical proportions — also the standard test for comparing two classifiers on the same test set.
Behavioral example: Whether an ad campaign shifts voter preference (support/not) among the same individuals polled before and after.
5. Explanatory Modeling & Prediction: The Regression Family¶
When the goal shifts from testing differences to building predictive equations or isolating the contribution of multiple predictors. Most of these belong to the Generalized Linear Model (GLM) family, which differ mainly in the assumed distribution of the outcome.
Simple Linear Regression¶
Alternative names: Bivariate regression, straight-line regression
Data features: One continuous predictor; one continuous outcome. Assumes linearity, independent and normal residuals, homoscedasticity.
When to use: To predict a continuous outcome from a single predictor.
Behavioral example: Predicting annual charitable donation from a self-reported empathy score.
Multiple Linear Regression¶
Alternative names: Ordinary least squares (OLS) multiple regression
Data features: Multiple continuous or dummy-coded predictors; one continuous outcome.
When to use: To isolate the impact of several factors on a continuous outcome simultaneously, controlling for confounds.
Behavioral example: Modeling productivity from sleep, coffee, experience, and remote-work status.
Binary Logistic Regression¶
Alternative names: Logit regression, logistic modeling
Data features: Multiple mixed predictors; one binary outcome (0/1).
When to use: Predicting the probability of a binary event or choice.
Behavioral example: Modeling whether a shopper completes a purchase or abandons the cart from browsing time and discount.
Ordinal Logistic Regression¶
Alternative names: Ordered logit, proportional-odds model
Data features: Multiple mixed predictors; one ordered categorical outcome (e.g., Low/Medium/High). Assumes proportional odds.
When to use: Predicting an inherently ranked but non-continuous outcome.
Behavioral example: Predicting treatment compliance (non/partial/full) from demographic and psychological scales.
Multinomial Logistic Regression¶
Alternative names: Polytomous logistic regression, multinomial logit
Data features: Multiple mixed predictors; one nominal outcome with ≥ 3 unordered choices.
When to use: Modeling discrete-choice behavior when options have no inherent ranking.
Behavioral example: Predicting which of four app themes a user selects from their personality and age.
Poisson Regression¶
Alternative names: Log-linear count model
Data features: Multiple mixed predictors; a count outcome (non-negative integers). Assumes the mean equals the variance.
When to use: Modeling behavioral frequencies over a fixed window of time or space.
Behavioral example: Modeling monthly support tickets from software-utilization metrics.
Negative Binomial Regression¶
Alternative names: Over-dispersed count model
Data features: Multiple mixed predictors; a count outcome whose variance exceeds its mean (over-dispersion).
When to use: The standard correction when count data show heavy tails and extreme variation, violating Poisson assumptions.
Behavioral example: Modeling daily phone checks, where a few super-users inflate the variance.
Zero-Inflated Models (ZIP / ZINB)¶
Alternative names: Zero-inflated Poisson, zero-inflated negative binomial
Data features: Count outcomes with far more zeros than a standard distribution predicts.
When to use: When zeros arise from two processes: ‘structural zeros’ (cannot/never perform the behavior) and ‘true zeros’ (could, but scored zero this time).
Behavioral example: Modeling daily cigarettes smoked: non-smokers always log 0, while quitting smokers may happen to log 0 on a given day.
Beta Regression¶
Alternative names: Proportional regression
Data features: A continuous outcome strictly bounded between 0 and 1 (rates, proportions, fractions, excluding exactly 0 and 1).
When to use: Predicting percentages or bounded allocations that show heteroscedasticity near the boundaries.
Behavioral example: Predicting the proportion of a monthly budget allocated to entertainment from psychometric scores.
6. Advanced: Clustered, Longitudinal, Survival & Time-Series Frameworks¶
For data that violate the assumption of independent observations, track hidden constructs, or unfold over time.
Linear / Generalized Mixed-Effects Models (LMM / GLMM)¶
Alternative names: Hierarchical linear modeling (HLM), multilevel modeling (MLM), random-effects models
Data features: Data that are nested or clustered (repeated trials within participants; students within schools).
When to use: Essential for behavioral data with dependencies. Splits effects into fixed effects (variables of interest) and random effects (baseline variation across individuals/clusters).
Behavioral example: Modeling how a learning game affects performance across 30 trials, allowing each player their own baseline skill.
Alternative names: Kaplan-Meier survival curve; log-rank (Mantel-Cox) test
Data features: A time-to-event outcome with right-censoring; one categorical grouping.
When to use: To estimate ‘time-until-behavior’ curves and compare them between groups — the descriptive/comparative step before Cox modeling.
Behavioral example: Comparing how long until animals in two enrichment conditions first use a novel object.
Cox Proportional-Hazards Model¶
Alternative names: Cox regression, survival analysis
Data features: Predictors mapped to a time-to-event outcome with right-censoring.
When to use: Modeling how predictors affect the time until a behavior or milestone occurs.
Behavioral example: Modeling days until a user cancels a subscription from engagement telemetry.
Alternative names: Lagged cross-correlation
Data features: Two time-aligned continuous signals.
When to use: To quantify how strongly two signals co-vary at different time lags — used to detect synchrony and lead-lag relationships between movement or physiological signals.
Behavioral example: Measuring whether one dancer’s motion leads or follows a partner’s, from the lag of peak correlation.
Dynamic Time Warping (DTW)¶
Alternative names: Elastic sequence matching (a similarity measure, not a hypothesis test)
Data features: Two sequences (e.g., pose or gesture time series) that may differ in speed or timing.
When to use: To measure similarity between two movement sequences while allowing local stretching/compression in time — foundational for gesture matching and behavior clustering.
Behavioral example: Quantifying how closely a learner’s tennis-serve trajectory matches an expert template despite a different tempo.
ARIMA¶
Alternative names: Box-Jenkins models; VAR for multiple parallel series
Data features: High-frequency sequential observations from one entity, where values correlate with their own past (autocorrelation).
When to use: Analyzing sensor streams or behavioral trends over continuous timelines to forecast future behavior.
Behavioral example: Forecasting next month’s daily active users from three years of history, filtering weekly and seasonal cycles.
Alternative names: Growth curve analysis, LGC analysis
Data features: A structural-equation framework on longitudinal data with repeated measurements over explicit time frames.
When to use: To model individual trajectories of growth, decline, or learning over time — not just group averages.
Behavioral example: Tracking how a child’s socio-emotional development trajectory shifts year-over-year from ages 5 to 12.
Latent Structure Discovery (PCA → EFA → CFA → SEM)¶
Data features: Many correlated variables believed to reflect a smaller set of hidden constructs.
When to use: A progression from data reduction to theory testing: PCA (compress correlated variables into uncorrelated components), EFA (discover hidden constructs), CFA (verify a predefined measurement structure), SEM (test complex multi-path theories with direct, indirect, and mediated effects).
Behavioral example: Reducing a battery of behavioral items to a few factors, then testing a theorized pathway among them with SEM.
Unsupervised Pattern Discovery (Clustering & Dimensionality Reduction)¶
Alternative names: k-means, hierarchical clustering, silhouette score, PCA / UMAP / t-SNE (exploratory, not hypothesis tests)
Data features: Many continuous features per observation, with no outcome labels.
When to use: To DISCOVER groupings or compress structure rather than test a hypothesis — clustering groups similar observations, the silhouette score judges cluster quality, and PCA/UMAP/t-SNE reduce dimensions for visualization. Confirm any discovered groups with independent hypothesis tests.
Behavioral example: Clustering extracted audio embeddings to reveal vocalization types, or grouping postures from pose features.
7. Directional & Circular Data¶
Angles and directions — joint angles, movement heading, time of day — live on a circle, where 0° and 360° are identical. Ordinary linear statistics mishandle this wrap-around (the mean of 350° and 10° is 0°, not 180°), so circular-specific methods are required. These are directly relevant to pose and movement analysis.
Rayleigh Test¶
Data features: One set of angles.
When to use: To test whether angles are uniformly spread around the circle versus clustered around a single mean direction.
Behavioral example: Testing whether an animal’s movement headings cluster in a preferred direction rather than being random.
V-Test¶
Alternative names: Modified Rayleigh test
Data features: One set of angles plus a hypothesized direction.
When to use: Like the Rayleigh test, but more powerful when you have an a-priori expected direction.
Behavioral example: Testing whether escape headings concentrate toward a known shelter direction.
Watson-Williams Test¶
Alternative names: Circular one-way ANOVA
Data features: Angles from two or more groups, reasonably concentrated (von Mises distributed).
When to use: To compare the MEAN directions of two or more groups — the circular analogue of ANOVA.
Behavioral example: Comparing mean limb-swing angle at toe-off between sprinters and joggers.
Watson’s U² Test¶
Alternative names: Watson two-sample U² test
Data features: Two sets of angles; non-parametric.
When to use: To compare two circular distributions without assuming a von Mises shape.
Behavioral example: Comparing the distribution of head-orientation angles between two behavioral states.
Circular Correlation¶
Alternative names: Circular-circular and circular-linear correlation
Data features: Two angular variables, or one angular and one linear variable.
When to use: To measure association involving angular data.
Behavioral example: Relating joint-angle phase to a continuous speed measure during gait.
8. Measurement Reliability & Agreement¶
When several coders annotate behavior, or a measure is repeated, you must quantify how consistent those measurements are before trusting them — a routine step whenever a team builds an annotation schema.
Cohen’s Kappa¶
Data features: Two raters; categorical (nominal) labels.
When to use: To measure agreement between two coders beyond what chance alone would produce.
Behavioral example: Two students independently labeling each video frame as groom / walk / rest.
Fleiss’ Kappa¶
Data features: Three or more raters; categorical labels.
When to use: The extension of Cohen’s kappa to more than two raters.
Behavioral example: A team of four annotators coding courtship behaviors.
Krippendorff’s Alpha¶
Data features: Any number of raters; nominal, ordinal, interval, or ratio data; tolerates missing ratings.
When to use: The most general agreement coefficient — useful when coders skip items or data types are mixed.
Behavioral example: Assessing agreement on an ordinal aggression-intensity scale where some clips were not coded by everyone.
Intraclass Correlation Coefficient (ICC)¶
Data features: Continuous measurements; two or more raters, or repeated measurements.
When to use: To quantify agreement/consistency for continuous ratings, and for test-retest reliability of a measure.
Behavioral example: Agreement among three raters’ continuous limb-angle estimates, or the stability of an automated metric across repeated recordings.
Bland-Altman Analysis¶
Alternative names: Limits-of-agreement plot
Data features: Two continuous measurement methods applied to the same units.
When to use: To visualize and quantify agreement between two measurement methods (e.g., manual vs. automated) — distinct from their correlation.
Behavioral example: Comparing joint angles from manual digitization against pose-estimation output.
9. Before You Test: Diagnostics, Robust & Resampling Methods¶
Choosing between parametric and non-parametric tests — and trusting any result — depends on first checking assumptions. These tools are how you decide.
Normality Checks¶
Alternative names: Shapiro-Wilk test, Kolmogorov-Smirnov / Anderson-Darling, Q-Q plot
Data features: One continuous variable, or a model’s residuals.
When to use: To judge whether the normality assumption holds. A small p-value (or a curved Q-Q plot) signals non-normality — consider a non-parametric or robust alternative.
Behavioral example: Checking whether stride-length residuals are normal before performing an ANOVA.
Homogeneity-of-Variance Checks¶
Alternative names: Levene’s test, Bartlett’s test, Brown-Forsythe
Data features: A continuous variable across two or more groups.
When to use: To test whether groups share equal variances (an assumption of Student’s t and standard ANOVA). If violated, switch to Welch’s t / Welch’s ANOVA.
Behavioral example: Confirming equal variance of reaction times across conditions before a standard ANOVA.
Permutation (Randomization) Tests¶
Alternative names: Exact or Monte-Carlo permutation tests
Data features: Almost any design.
When to use: To obtain a p-value by repeatedly shuffling labels rather than assuming a theoretical distribution — ideal for small or oddly-shaped behavioral samples.
Behavioral example: Testing a group difference in a small movement study by permuting condition labels 10,000 times.
Bootstrap¶
Alternative names: Resampling with replacement
Data features: Almost any statistic.
When to use: To estimate confidence intervals and standard errors for any metric (means, medians, correlations, custom indices) without distributional assumptions.
Behavioral example: A 95% confidence interval for a custom gait-symmetry index by resampling participants.
Always report an effect size (Cohen’s d, η², r, odds ratio) alongside every p-value, and correct for multiple comparisons (Bonferroni, Holm, or FDR) whenever you run many tests.